Osvanta Bus Log Analyzer
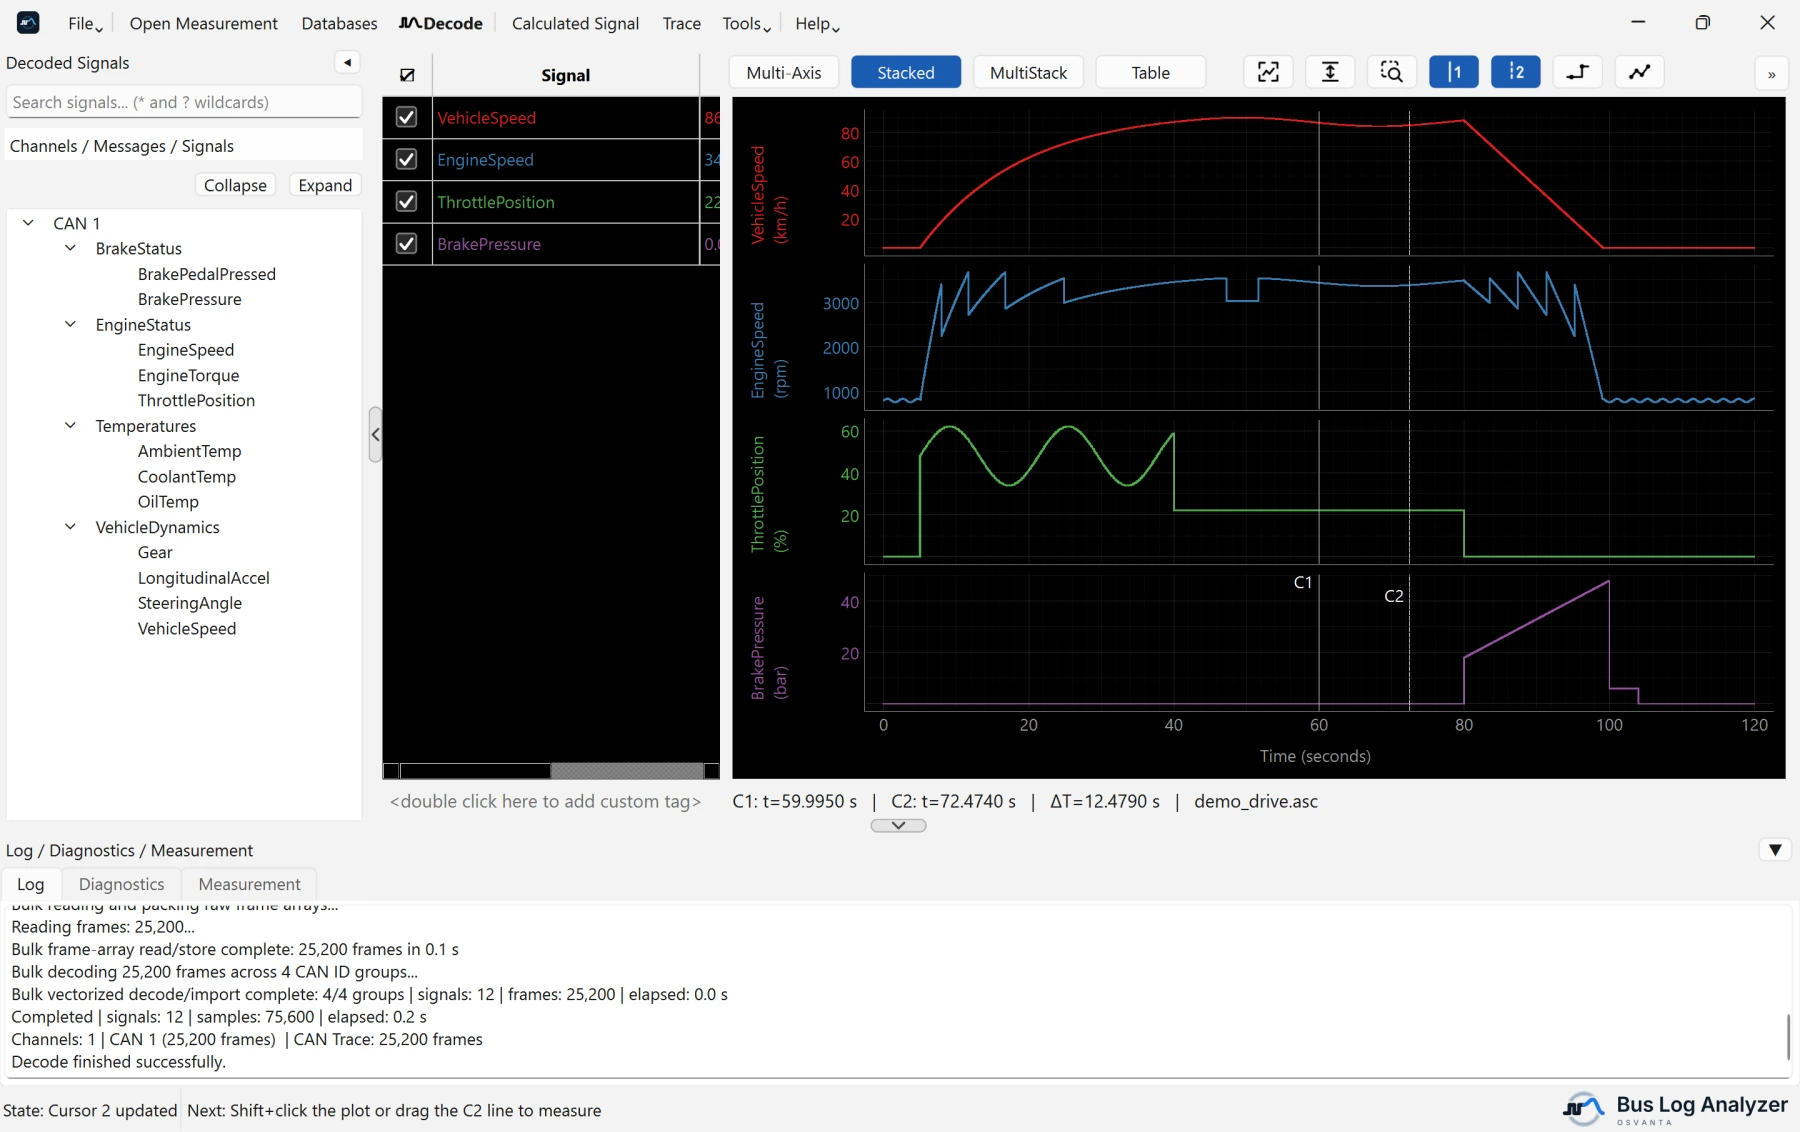
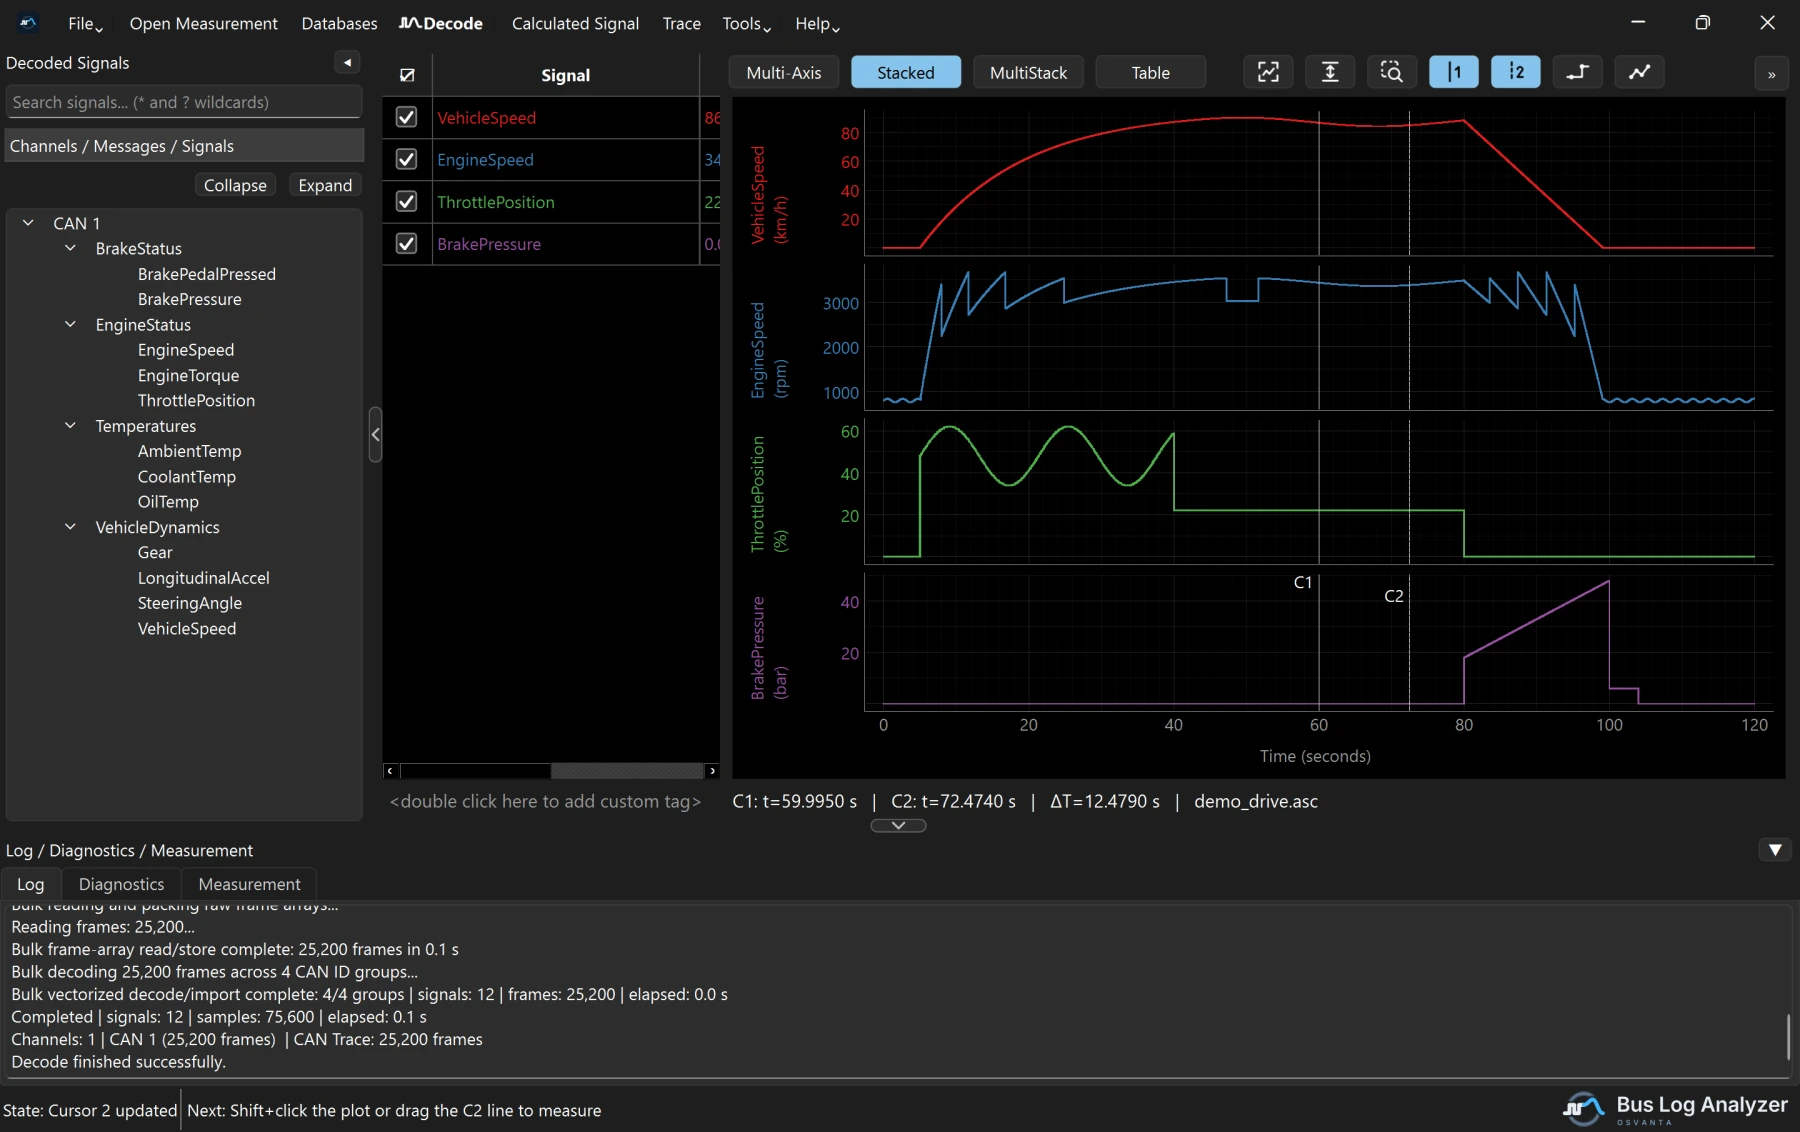
A portable Windows tool for automotive measurements. Open a CAN or LIN bus log, decode it with your DBC, ARXML or LDF databases, and plot the signals.
Where to start
- New to the tool? Getting started takes you from a measurement file to your first plot in five minutes.
- Looking for a key? See the keyboard shortcuts.
- Stuck, or found a problem? See Help and troubleshooting.
- Prefer to watch? The tutorial videos are on YouTube.
Get the application
Download BusLogAnalyzer_<version>_Windows.zip from the
latest release,
extract it, and run BusLogAnalyzer.exe. There is nothing to install, and no
Python is needed.
What it opens
| Measurement | Content | Database |
|---|---|---|
BLF (.blf) |
Raw CAN and LIN frames | DBC or ARXML for CAN, LDF for LIN |
ASC (.asc) |
Raw CAN and LIN frames | DBC or ARXML for CAN, LDF for LIN |
TRC (.trc) |
Raw CAN frames, from PEAK trace files (versions 1.0 to 3.0) | DBC or ARXML |
MDF4 and MDF3 (.mf4, .mdf) |
Raw CAN or LIN bus logging, or decoded signals | Only for raw bus logging |
CSV (.csv) |
A raw CAN export, or signals in columns | Only for raw CAN data |
The application finds out for itself what an MDF or CSV file holds.
What it does
- Decodes large measurements fast, channel by channel, with a database for each channel.
- Lists every channel, message and signal in a tree you can search, with
*and?wildcards, and shows each signal's definition from its database on request. - Plots signals in Stacked, Multi-Axis or MultiStack mode, with two cursors, statistics between them, named markers and Rectangle Zoom, or lists the plotted signals as a table.
- Calculates new signals from others with a formula.
- Shows the Trace: the raw CAN and LIN frames, in order, with the time since each ID's previous frame and its changed bytes highlighted.
- Exports plotted signals to CSV, Excel or MF4, and saves the whole session as a configuration.
- Converts, joins and cuts measurement files, and says what a file holds before you decode it.