
Free and open source for Windows
Bus Log Analyzer
Load an automotive measurement, decode its CAN and LIN signals with your DBC, ARXML or LDF databases, inspect the raw frames, and plot the signals interactively.
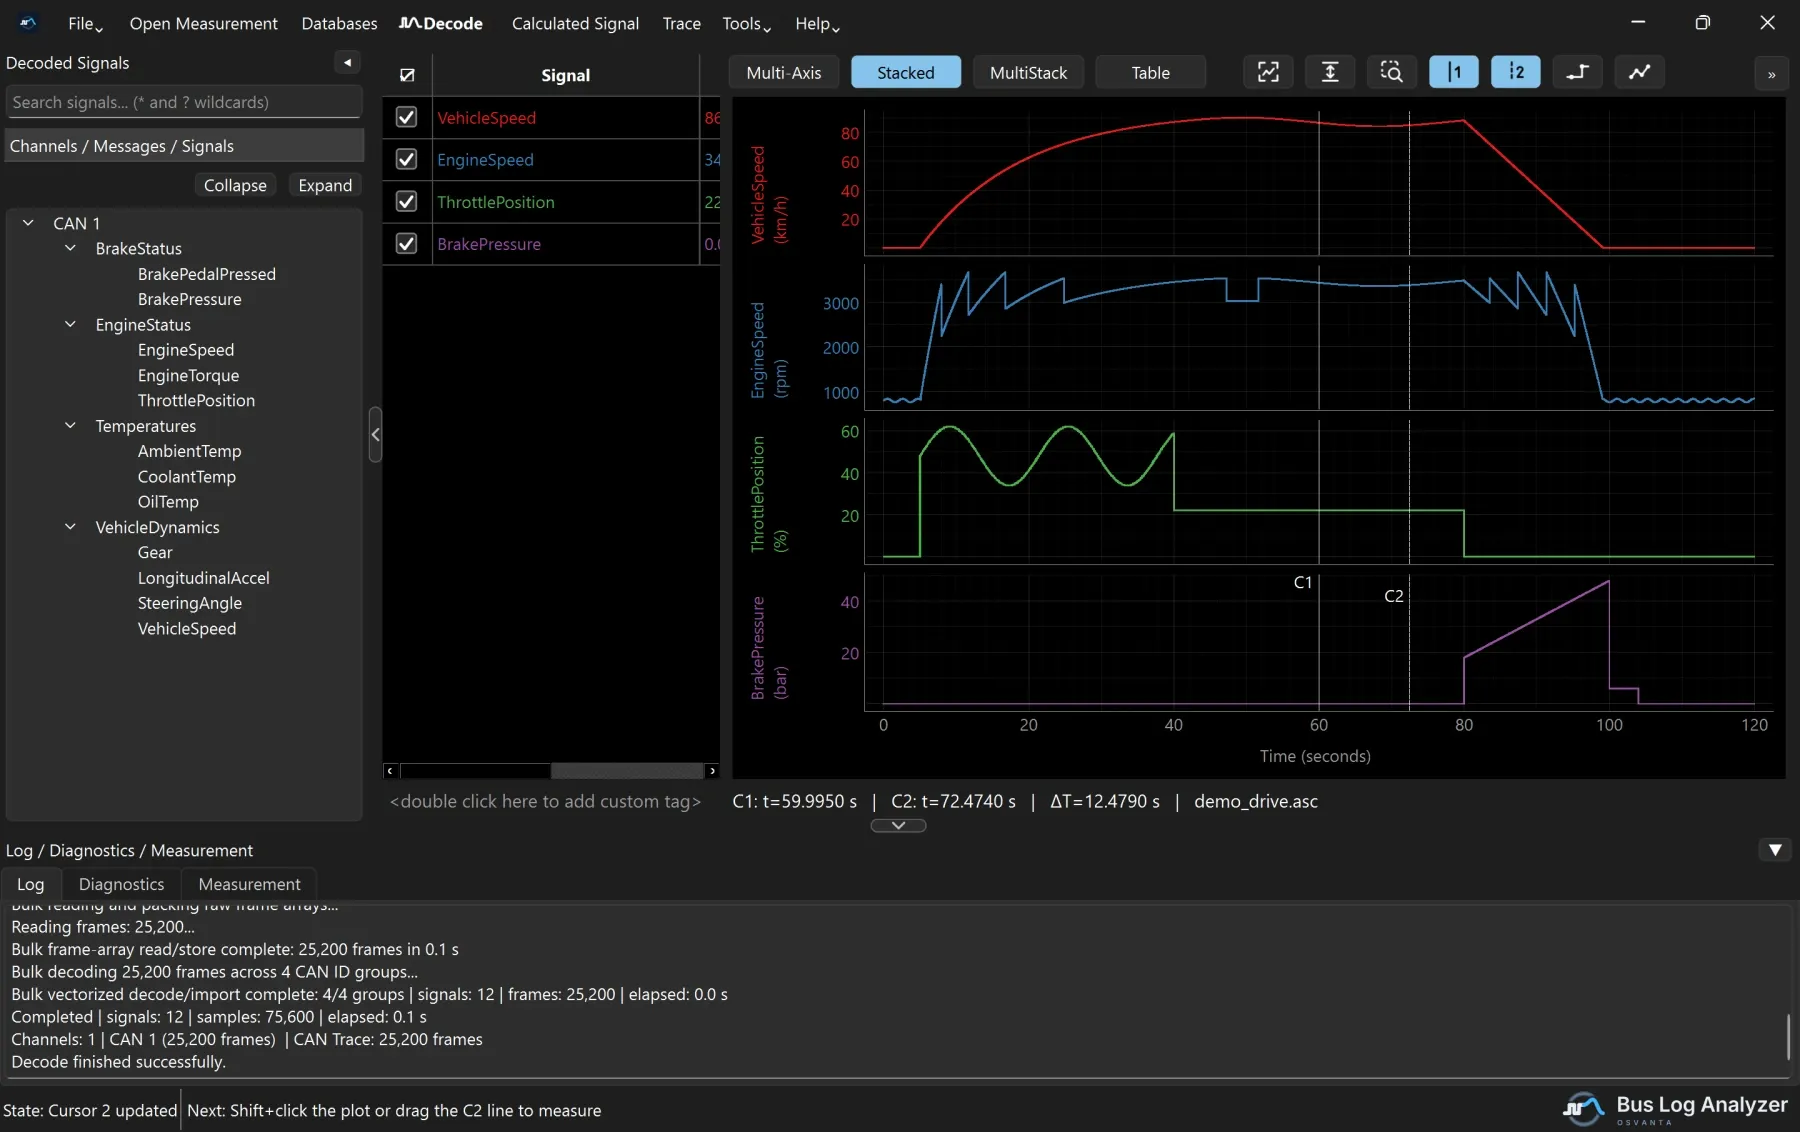
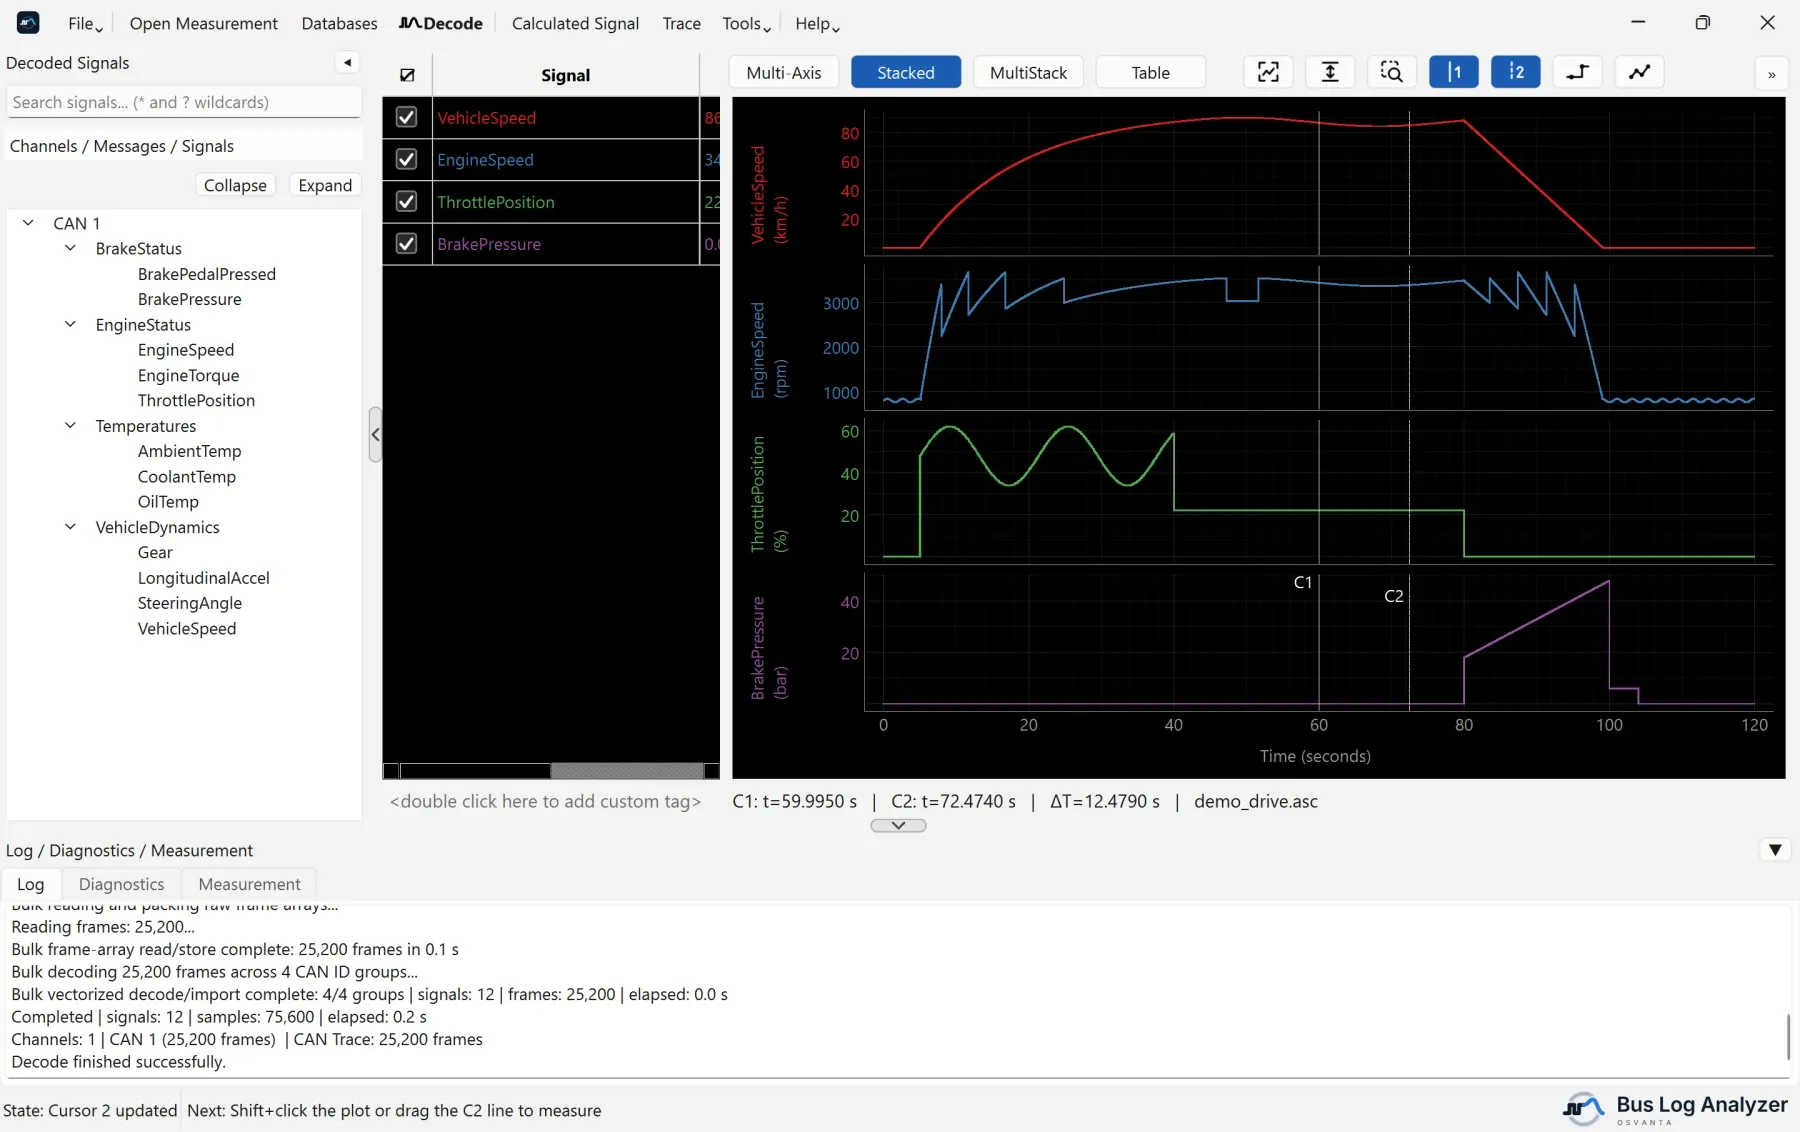
What it does
Load large measurements
Fast bulk loading and decoding, in memory that does not grow with the size of the file.
Find signals quickly
A searchable channel, message and signal tree with wildcards, multi-select plotting and drag-and-drop.
Three plot modes, in tabs
Stacked lanes, Multi-Axis overlay, or MultiStack lanes that each hold several signals.
Cursors and statistics
Two cursors with delta time, and Min, Max, Mean, Std dev and RMS over the visible range or between the cursors.
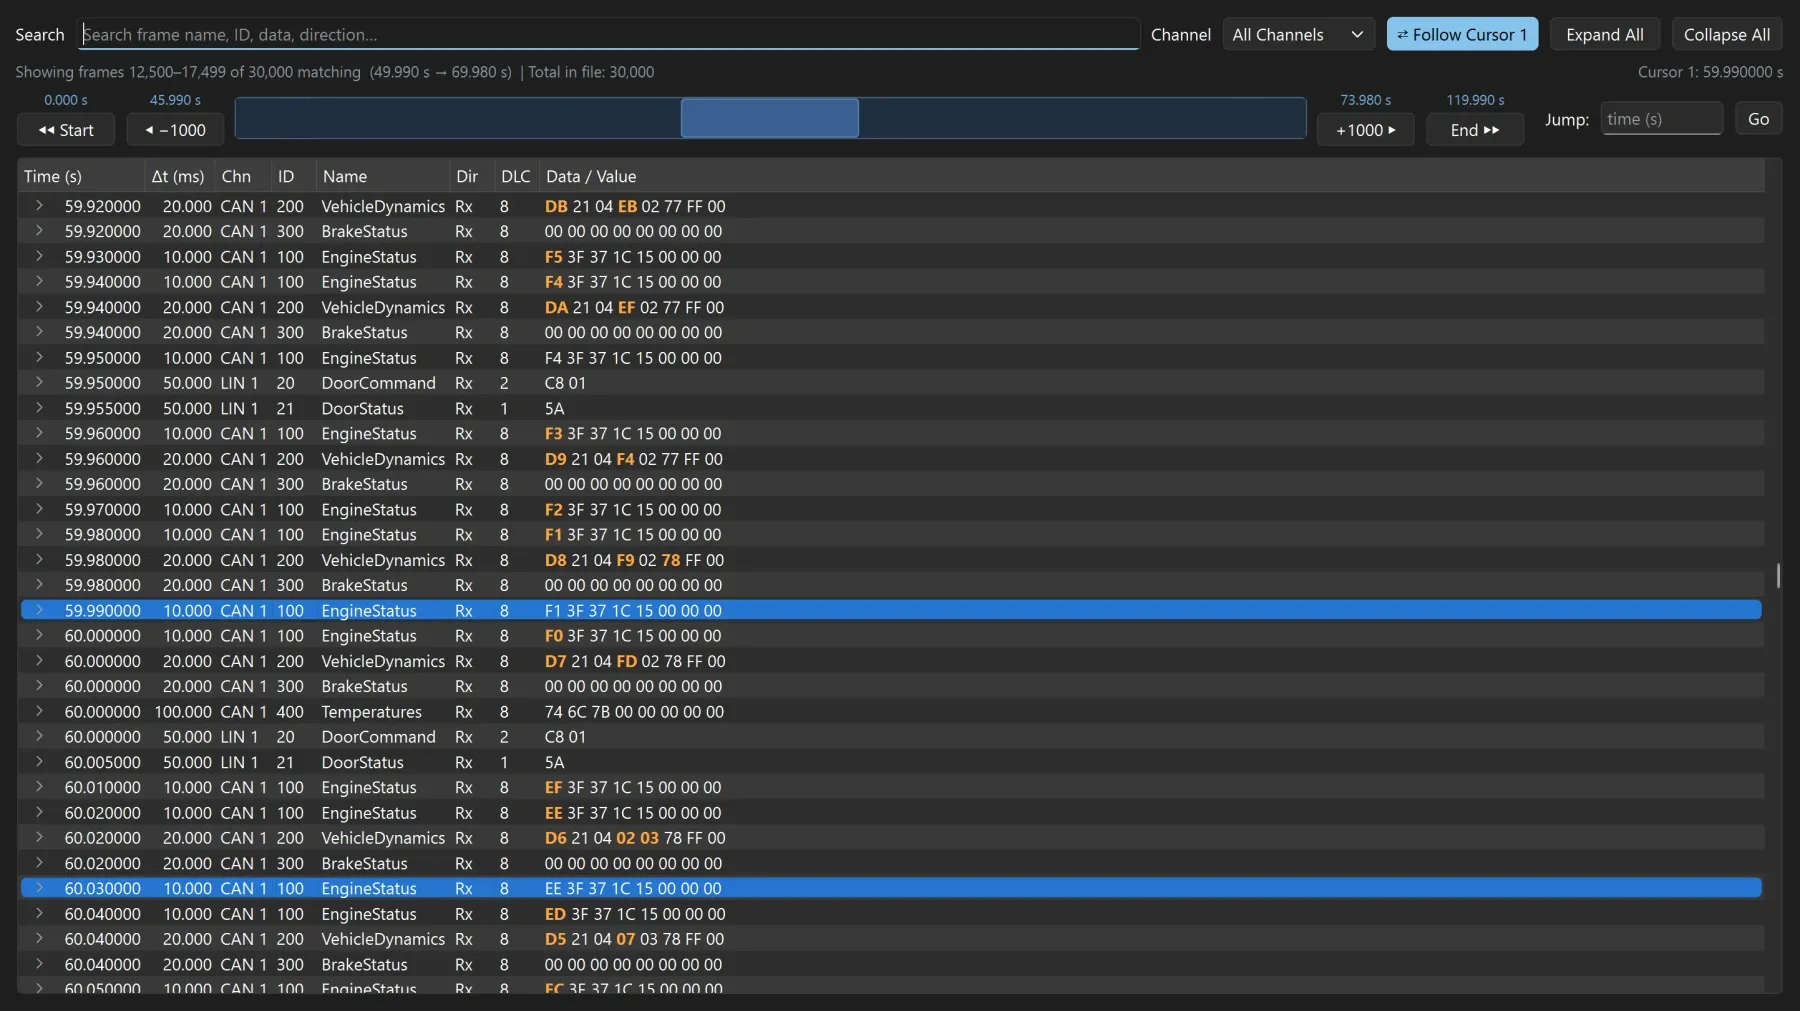
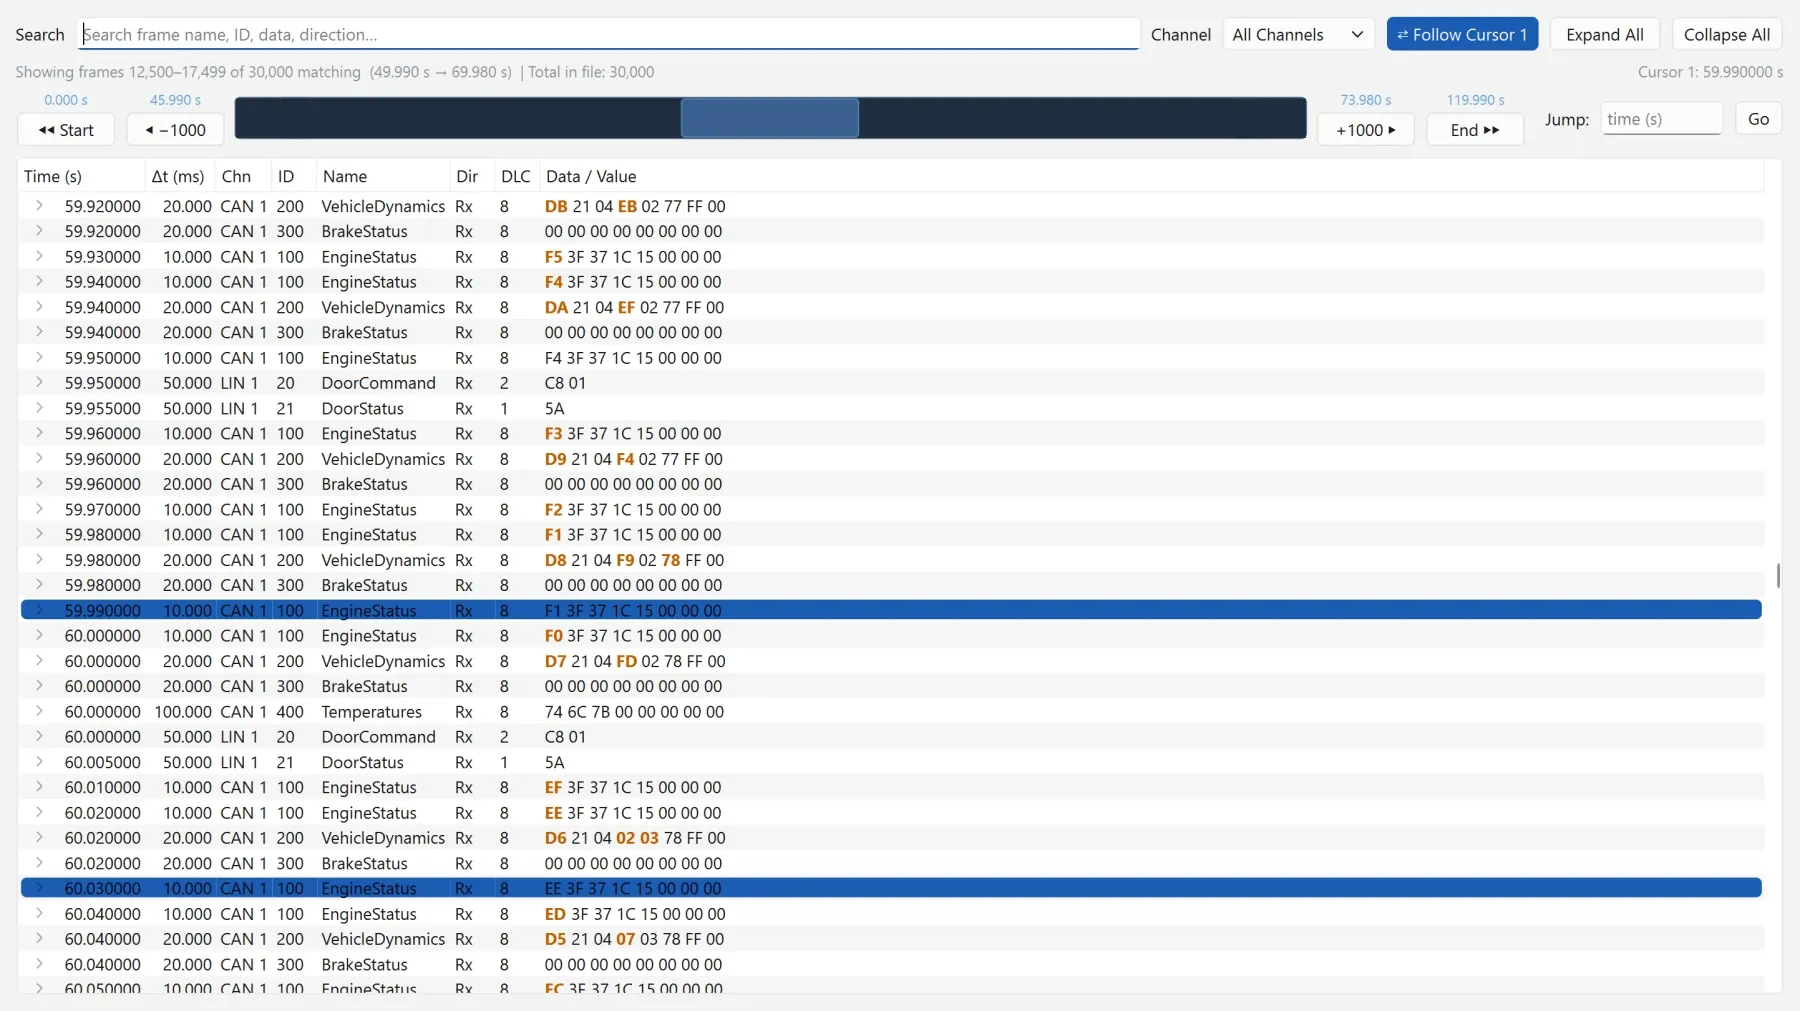
Raw frame Trace
Every CAN and LIN frame, with the time since the previous frame of the same ID and changed bytes highlighted.
Calculated signals
New signals from formulas: arithmetic, comparisons, logic and temporal operations.
Export and convert
Export plotted signals to CSV, Excel or MF4, and join, cut, resample and convert measurement files.
Pick up where you left off
Save a configuration of files, databases and plot layout, or reopen the last session at the next start.
See the signals and the frames behind them
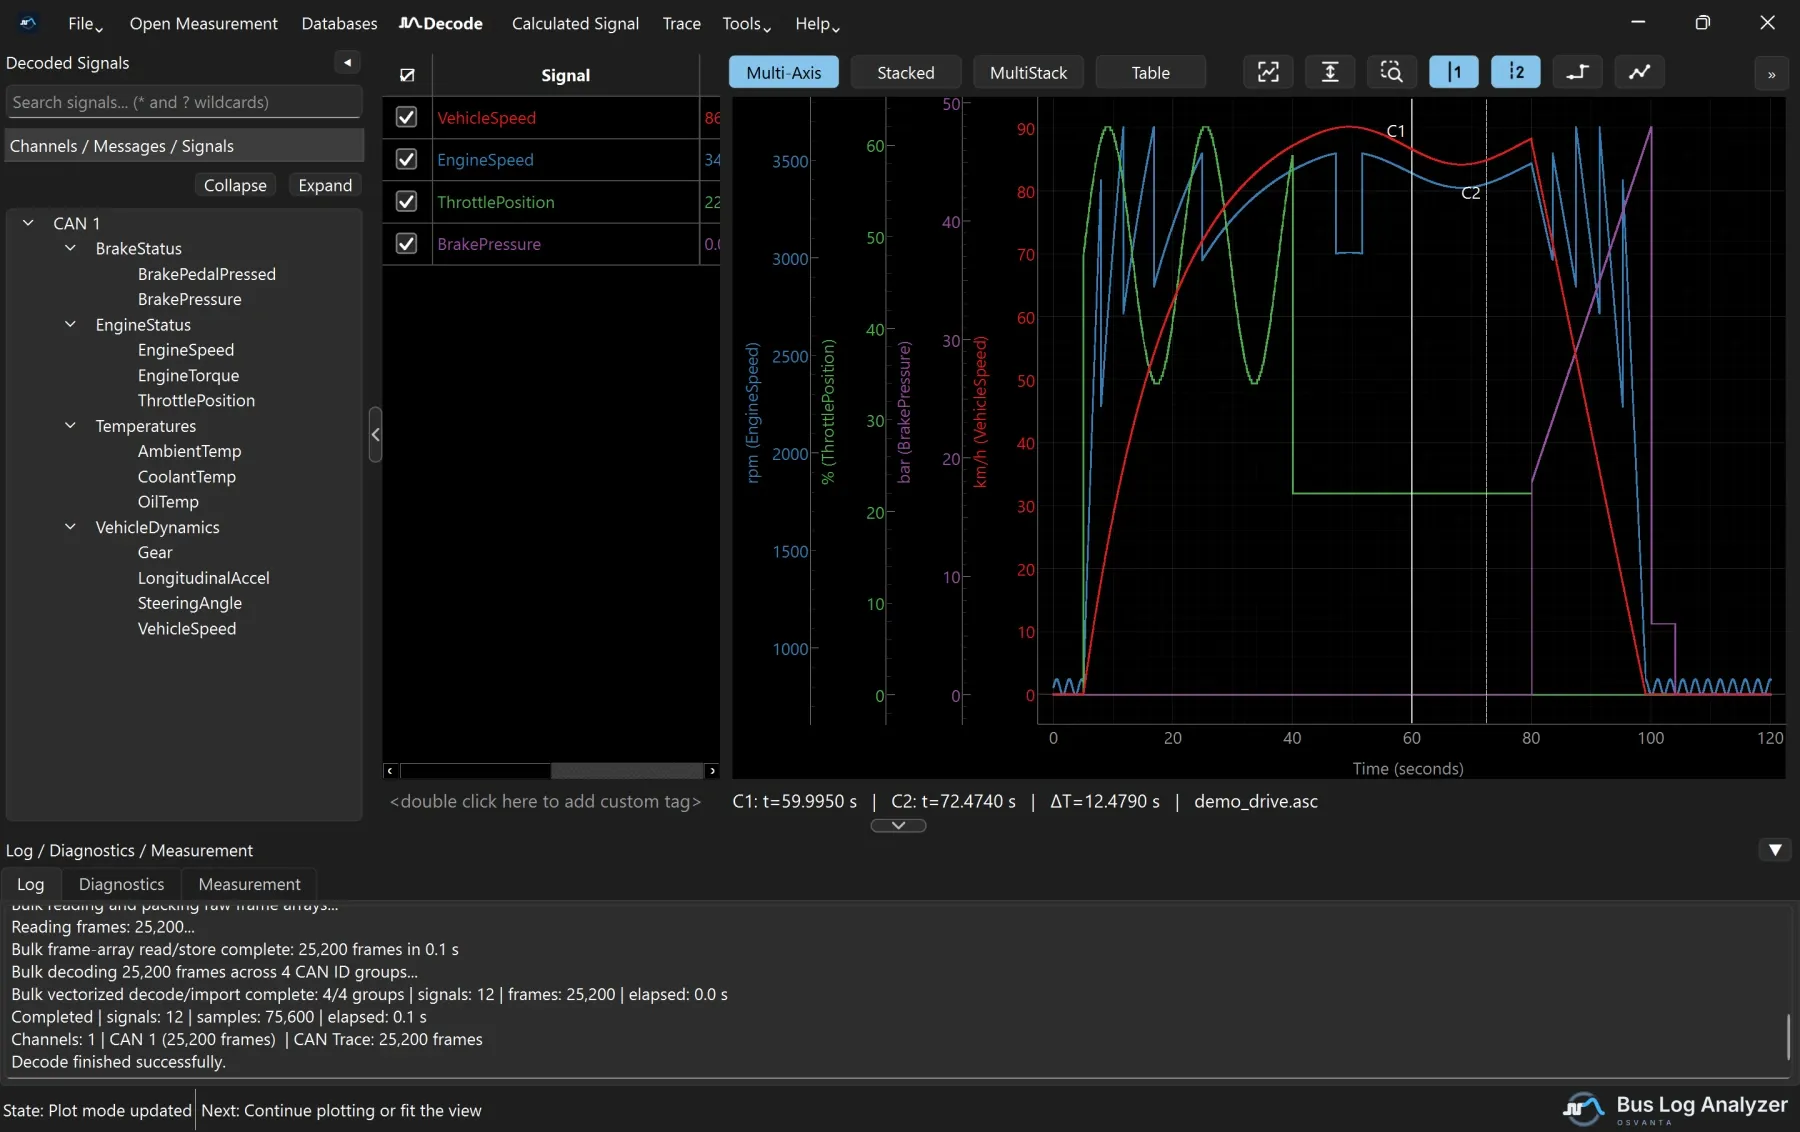
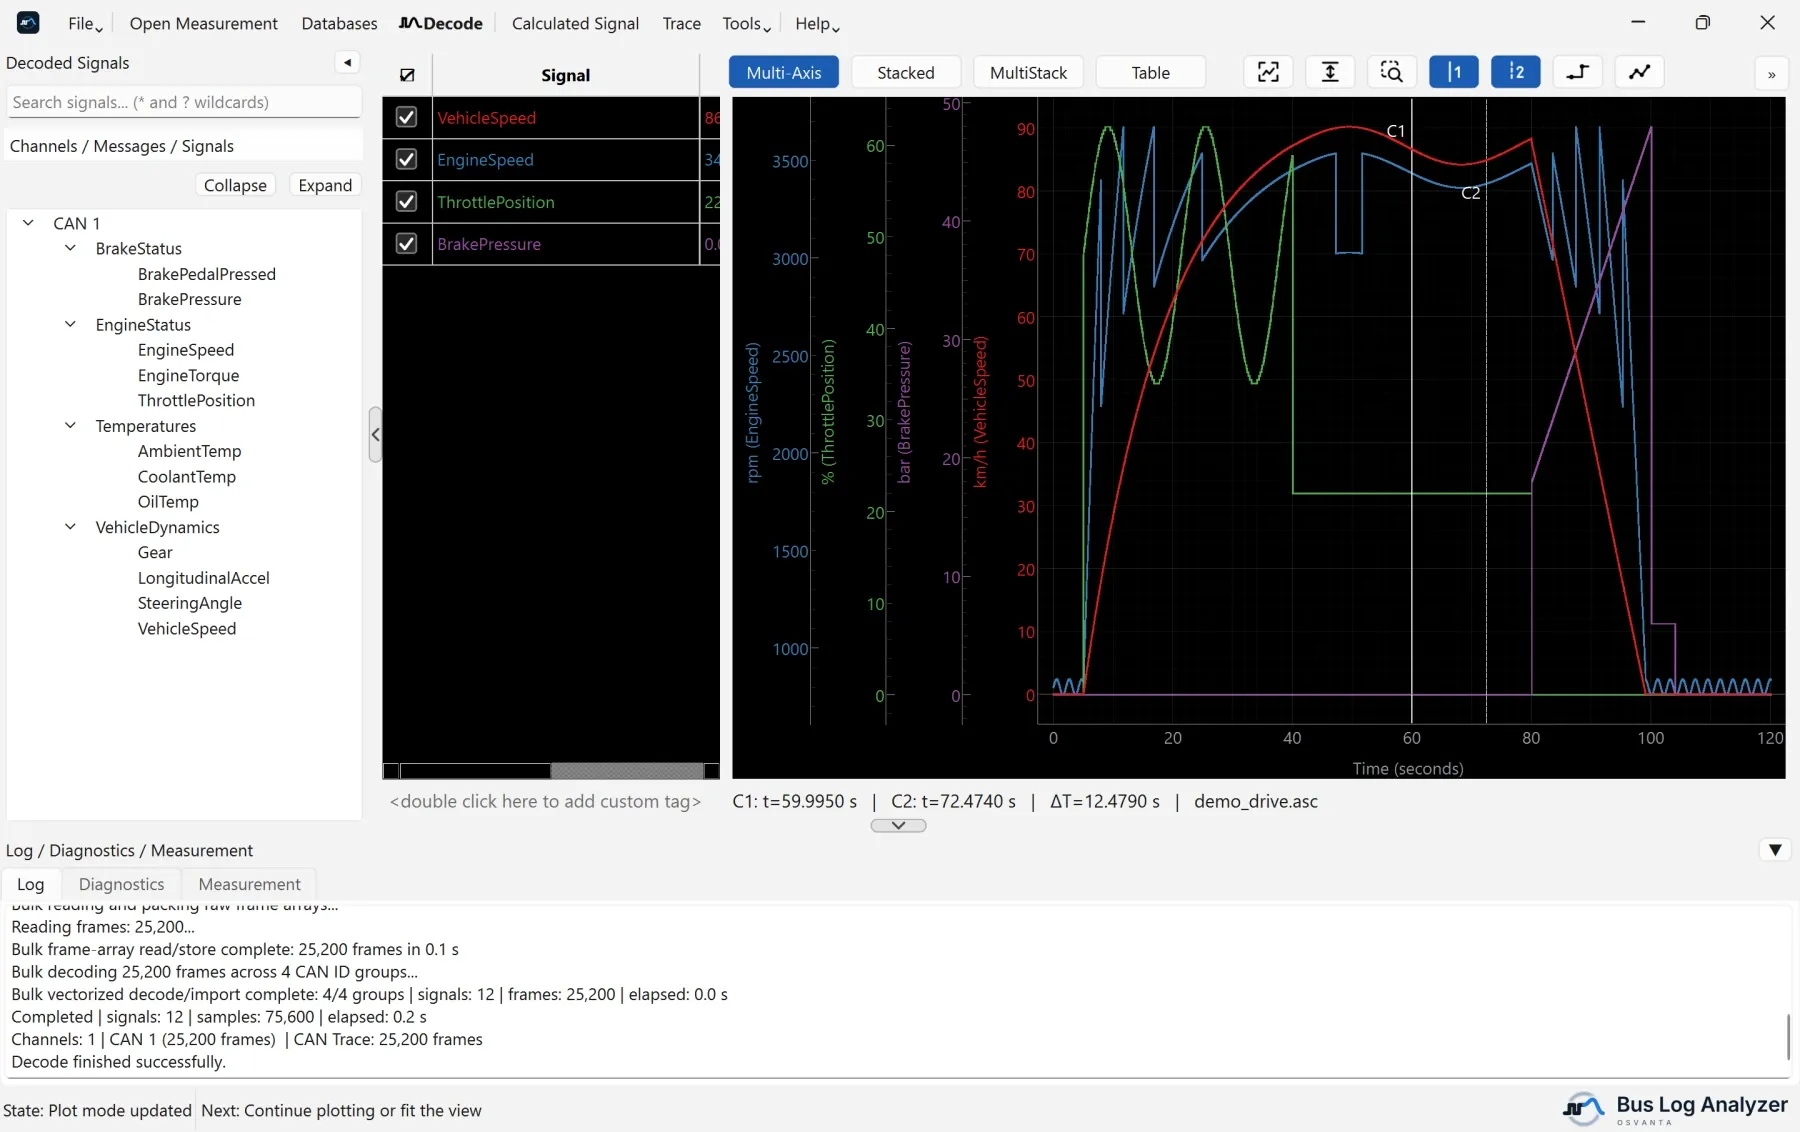
Supported formats
MDF and CSV content is detected automatically. The Database Manager assigns a database to each bus channel and shows how well it matches the frames on that channel.
| Measurement | Content | Database |
|---|---|---|
| BLF (.blf) | Raw CAN and LIN frames | DBC or ARXML for CAN, LDF for LIN |
| ASC (.asc) | Raw CAN and LIN frames | DBC or ARXML for CAN, LDF for LIN |
| TRC (.trc) | Raw CAN frames from PCAN trace files, versions 1.0 to 3.0 | DBC or ARXML |
| MDF4 / MDF3 (.mf4, .mdf) | Raw CAN or LIN bus logging, or decoded signals | Only for raw bus logging |
| CSV (.csv) | Raw CAN export, or signals in narrow or wide layout | Only for raw CAN data |
Your measurements stay on your computer
The application opens no network connection of its own. It has no telemetry, no usage statistics and no update checks, never changes the files you open, and runs without administrator rights or an installer.
The source is public under MPL-2.0, and each release is built from it by GitHub Actions with checksums and a software bill of materials.
Learn it in a few minutes
Getting started takes you from a measurement file to your first plot in five minutes. The help section covers every part of the tool in detail, and the tutorial videos show it in use.