
Plotting
Plot signals, choose a plot mode, work in tabs, and change how each signal looks.
Plot a signal
Plot a signal from the tree in any of these ways:
- double-click it;
- select one or more and press
Space; - drag them onto the plot;
- right-click them and choose Plot selected signal(s).
Plotted signals appear in the signal table beside the plot, with their values at the cursors.
Plot modes
The first buttons above the plot choose the mode: Multi-Axis, Stacked and MultiStack, in that order. The same signals stay plotted when you switch, so you can look at them in each mode in turn.
Multi-Axis
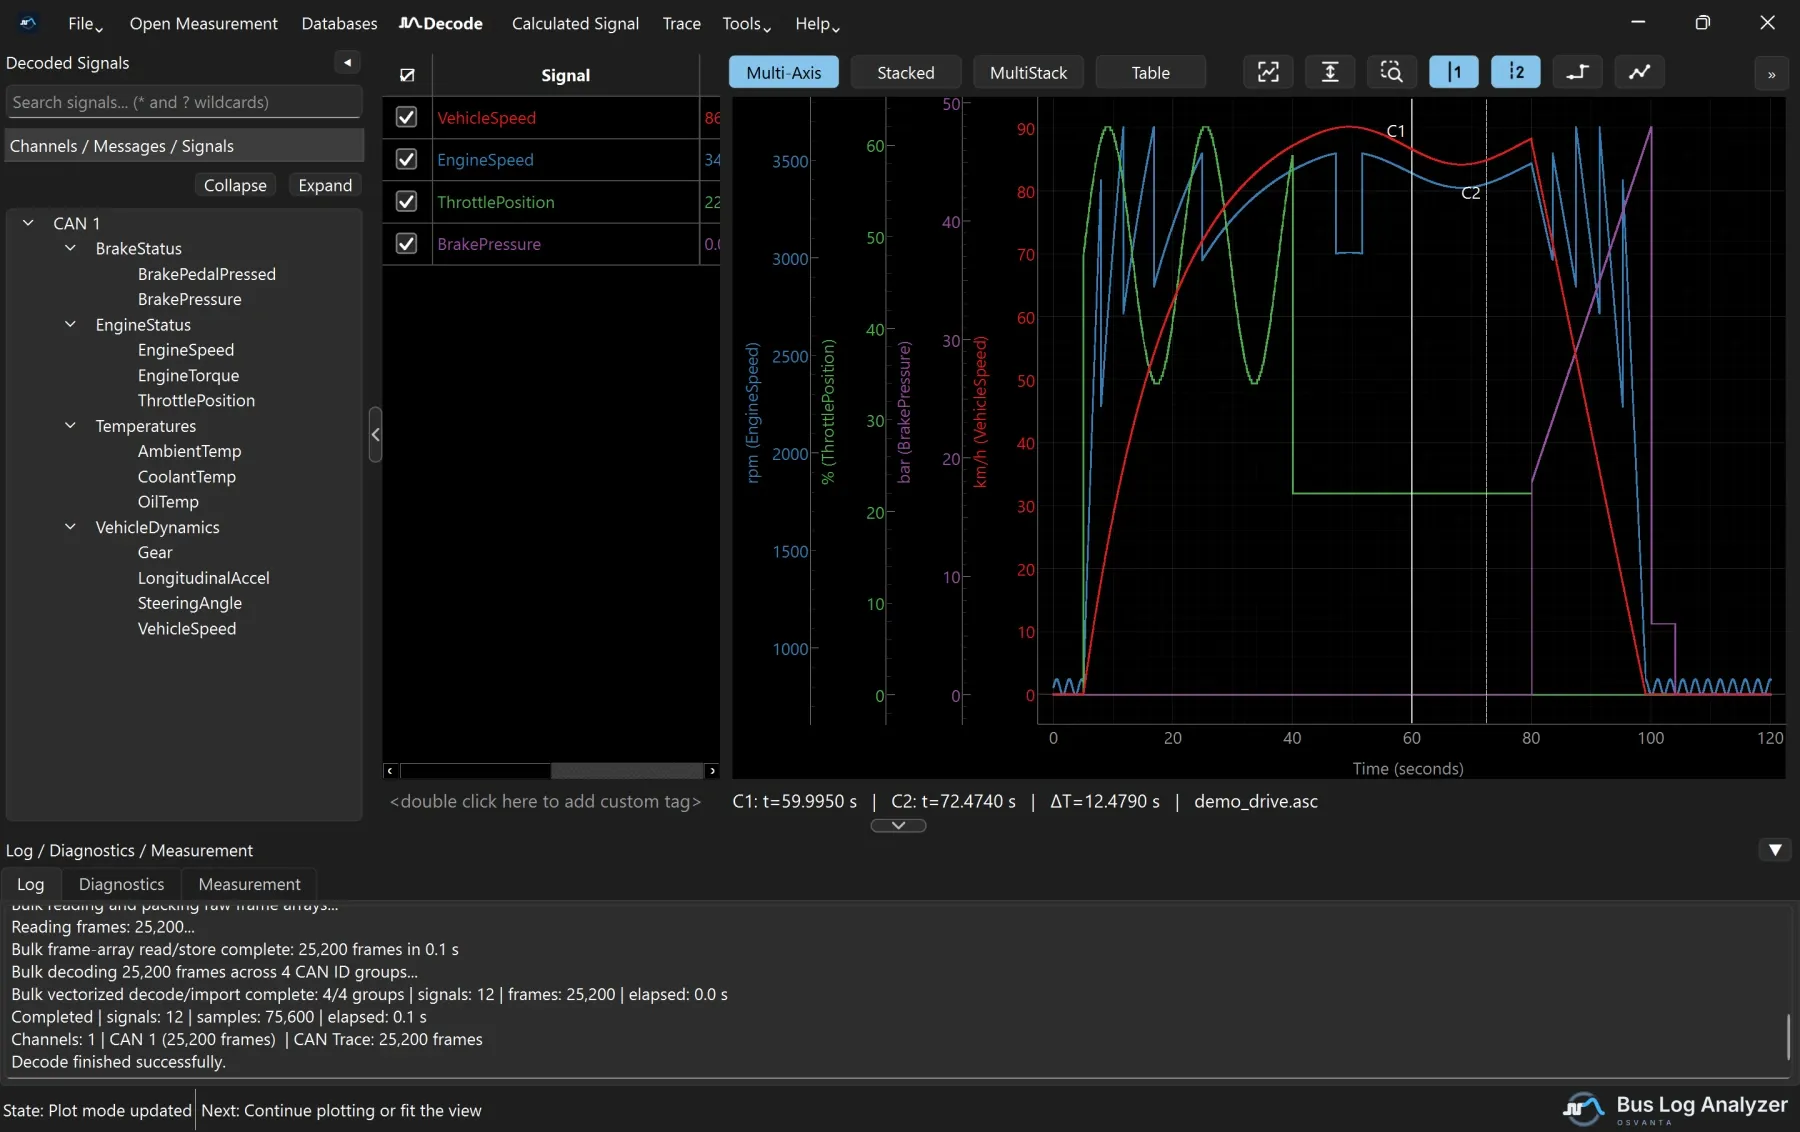
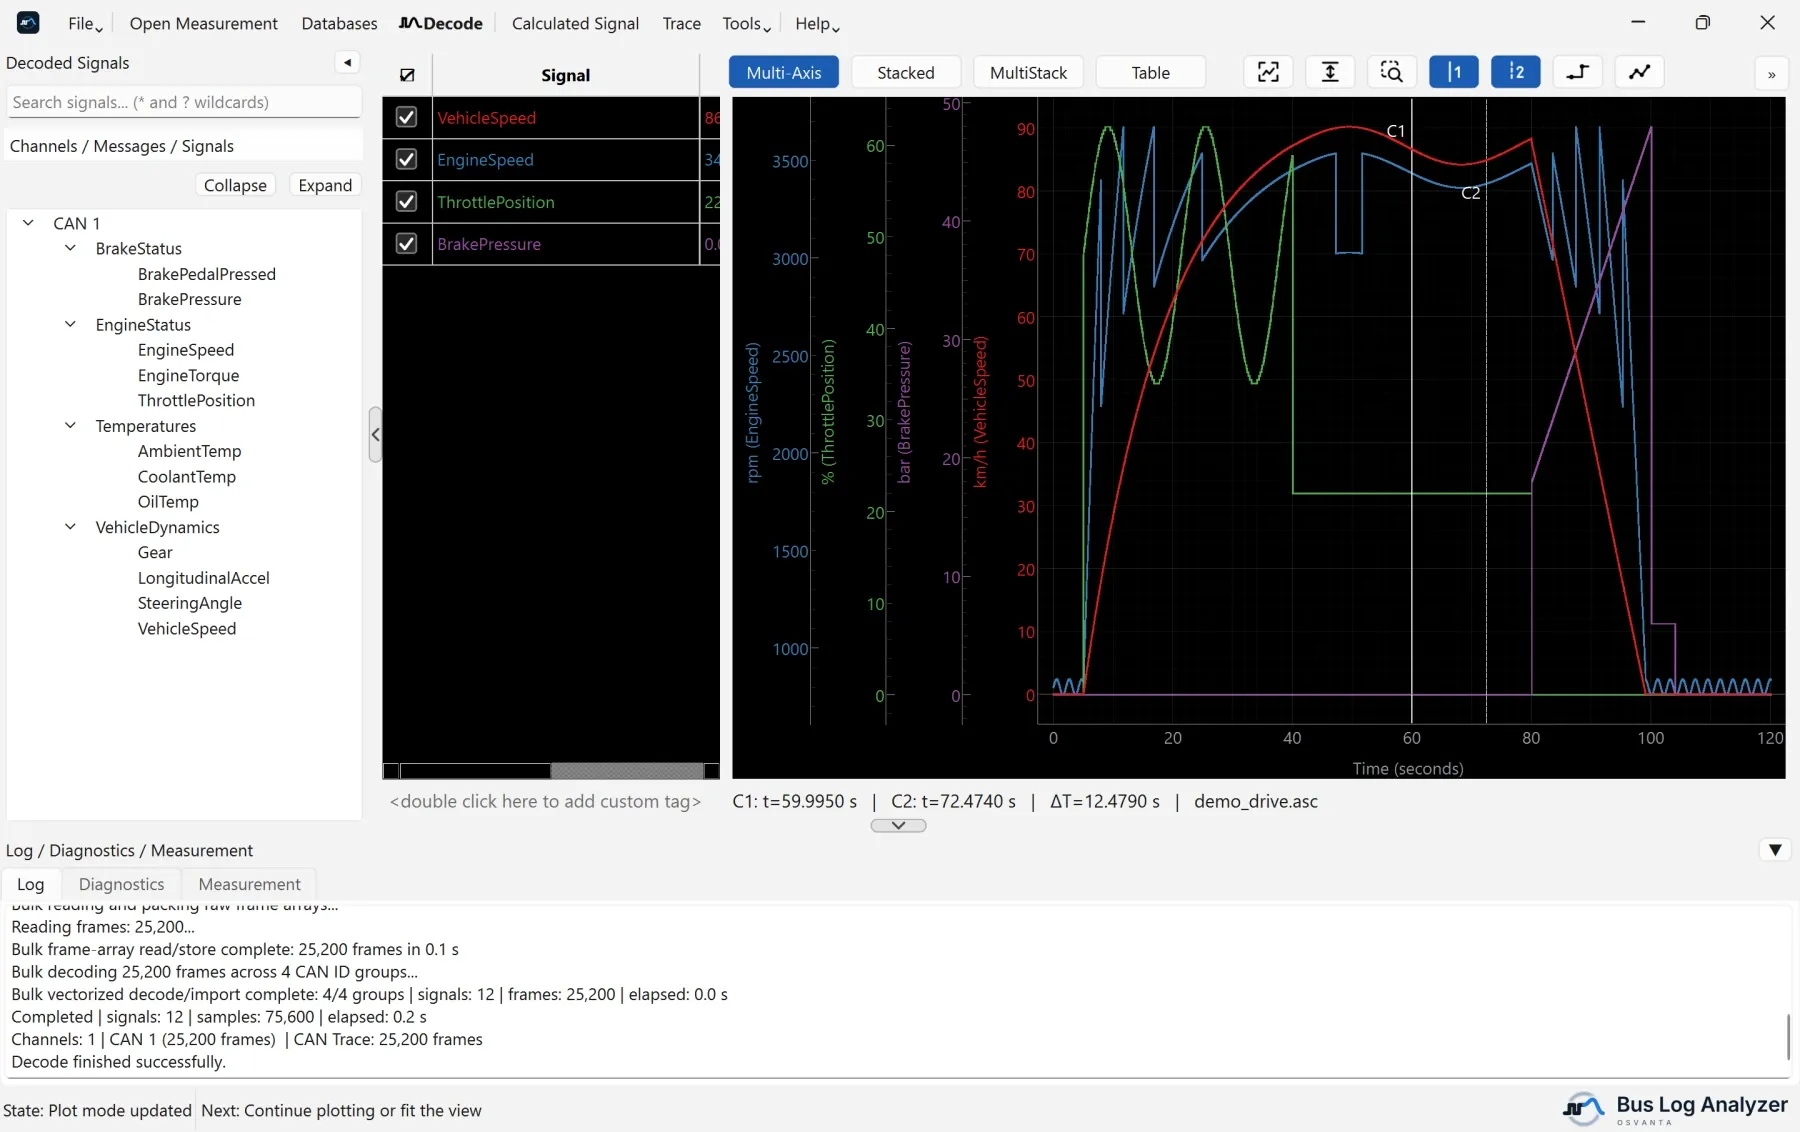
All signals are drawn over each other in one plot area. Signals with the same unit share a Y axis, and a signal can be given an axis of its own. Use it to see how signals relate at the same moment, for example how engine speed follows the throttle.
Stacked
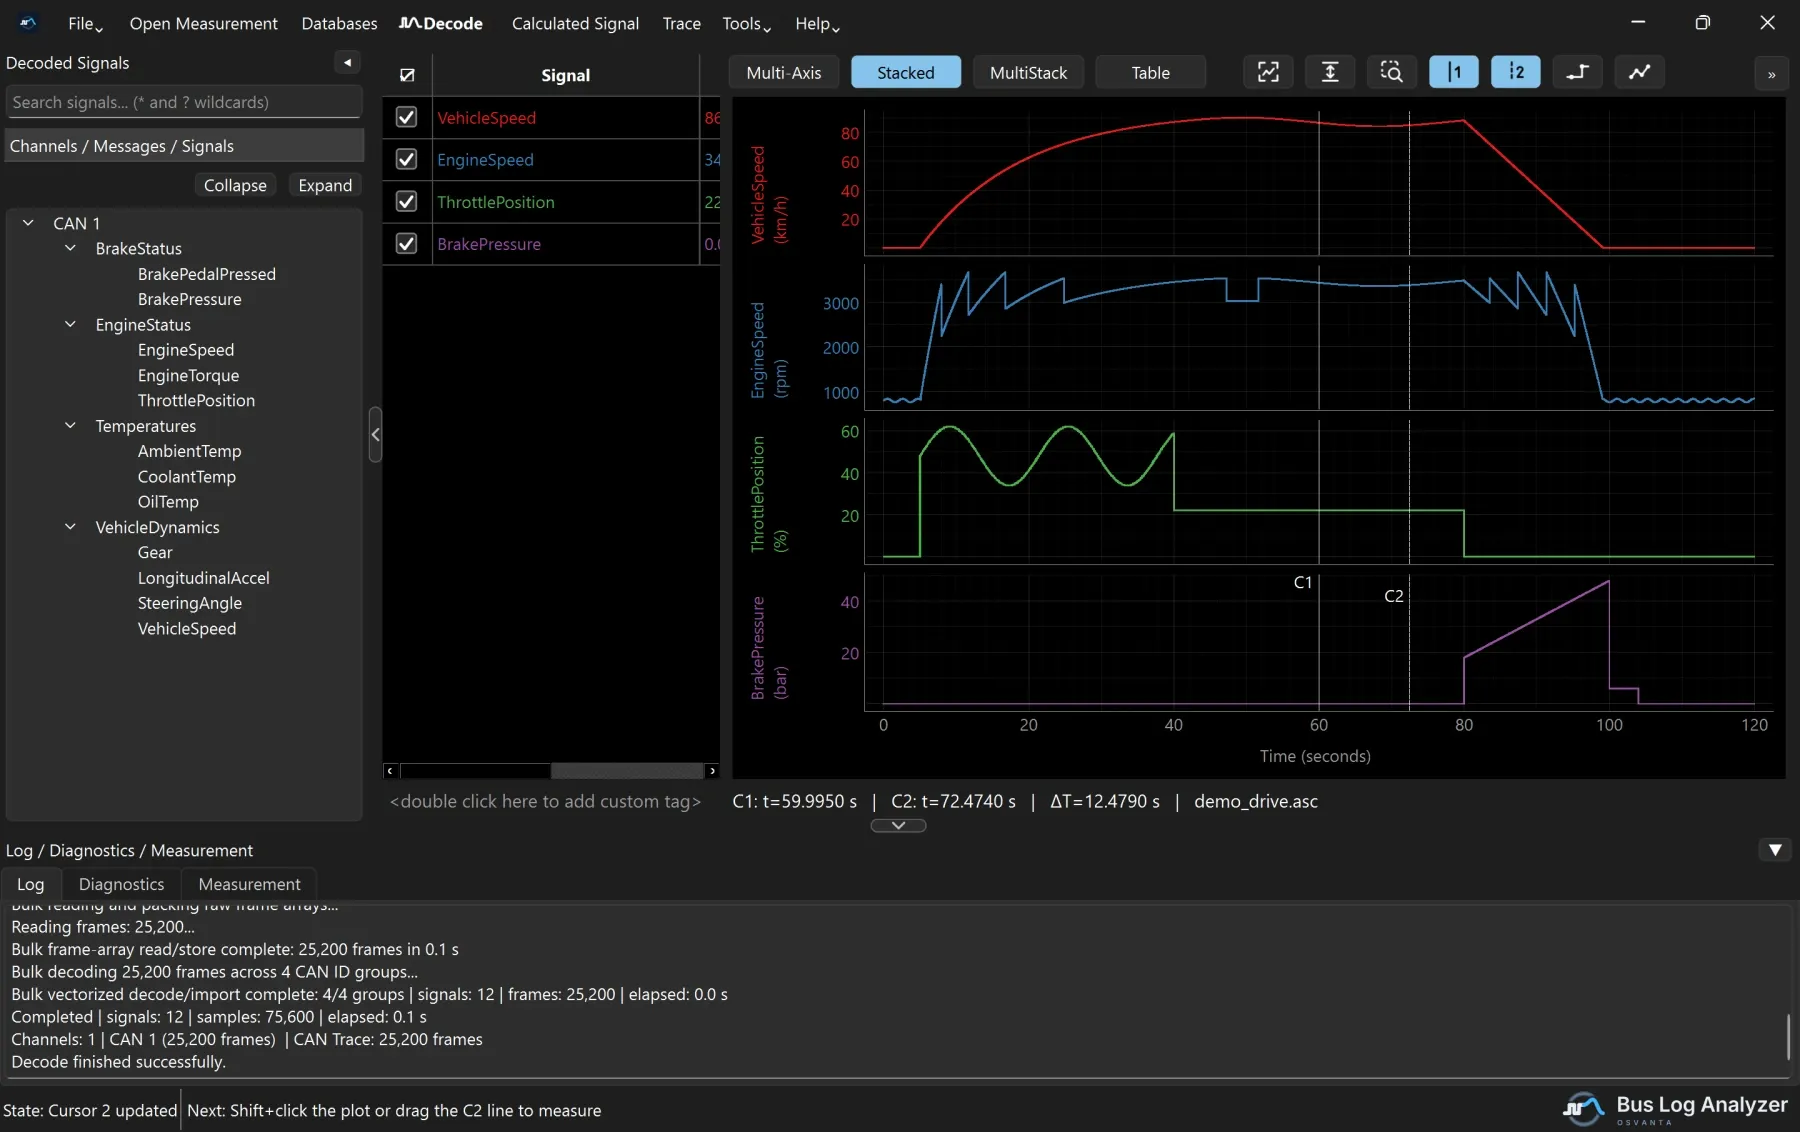
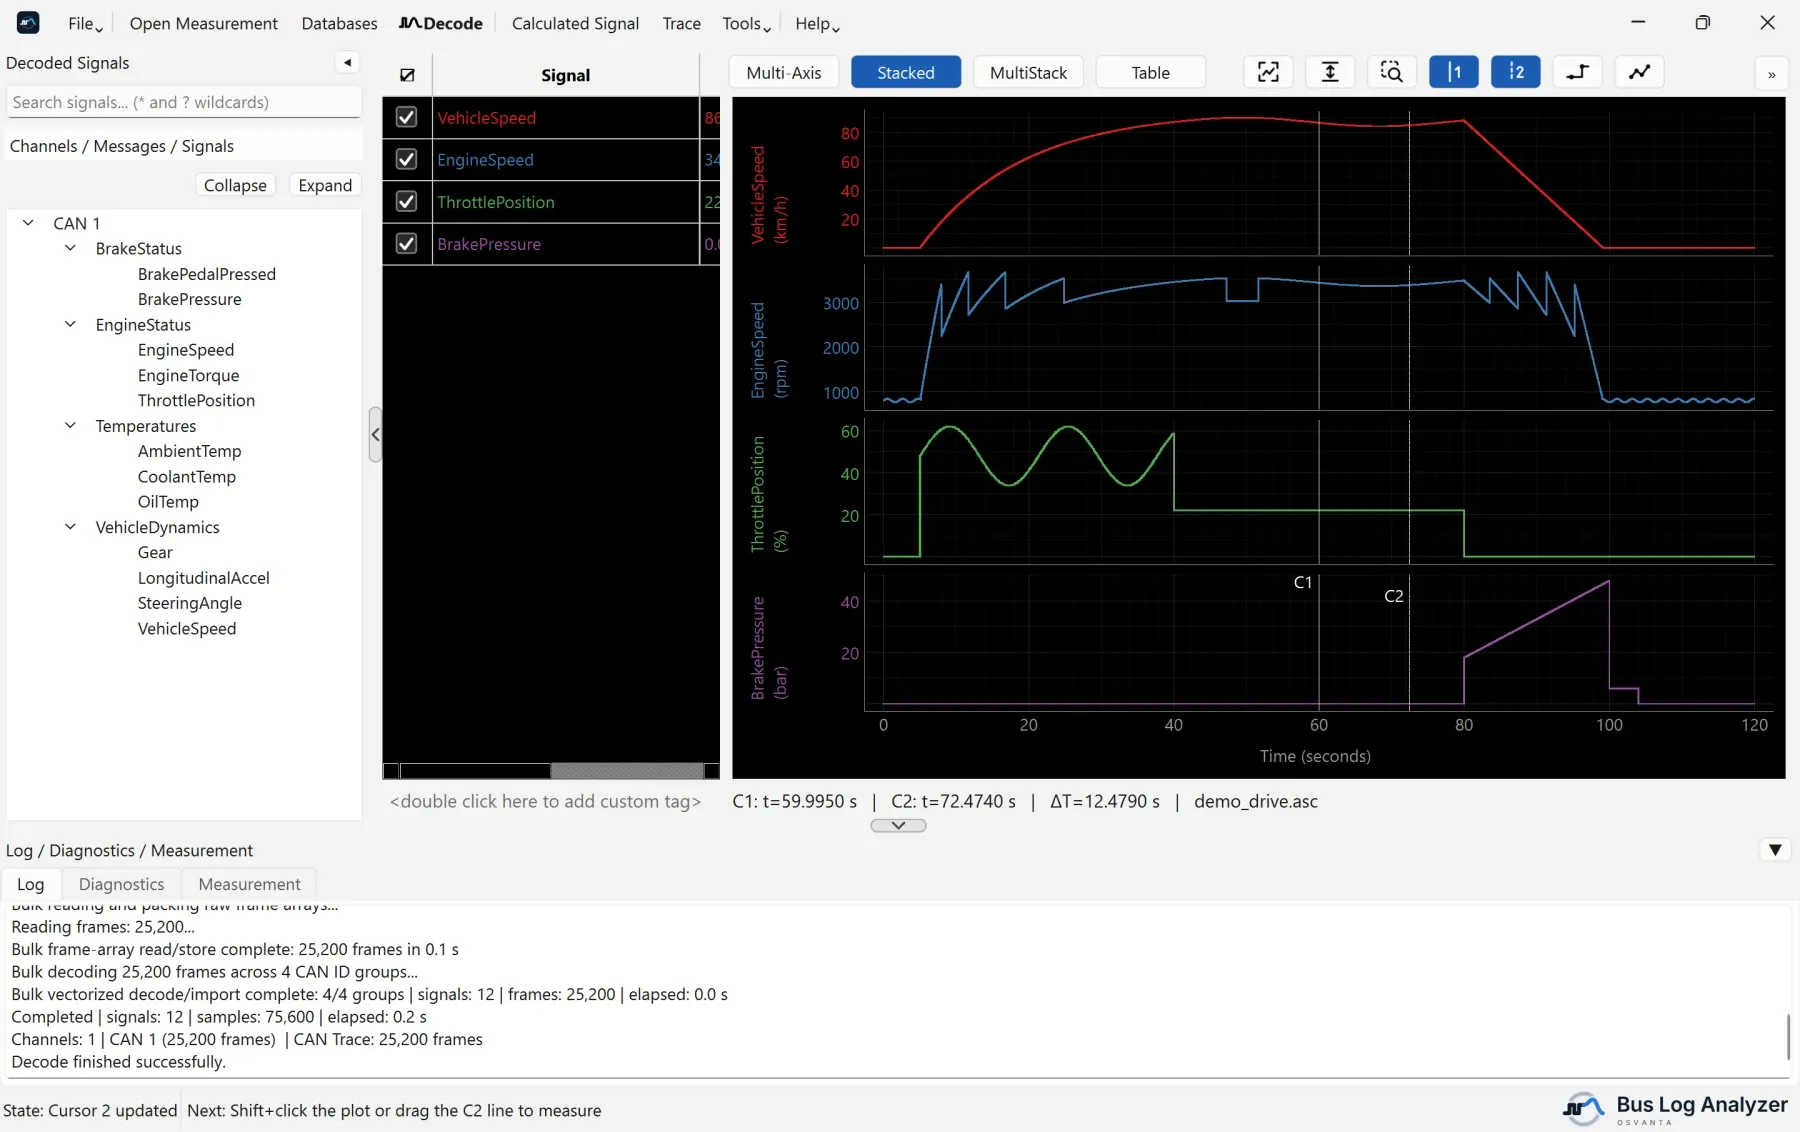
Each signal has its own lane with its own Y scale, one under the other on a shared time axis. This is the mode the tool starts in. Use it to compare shapes and timing without the signals covering each other.
MultiStack
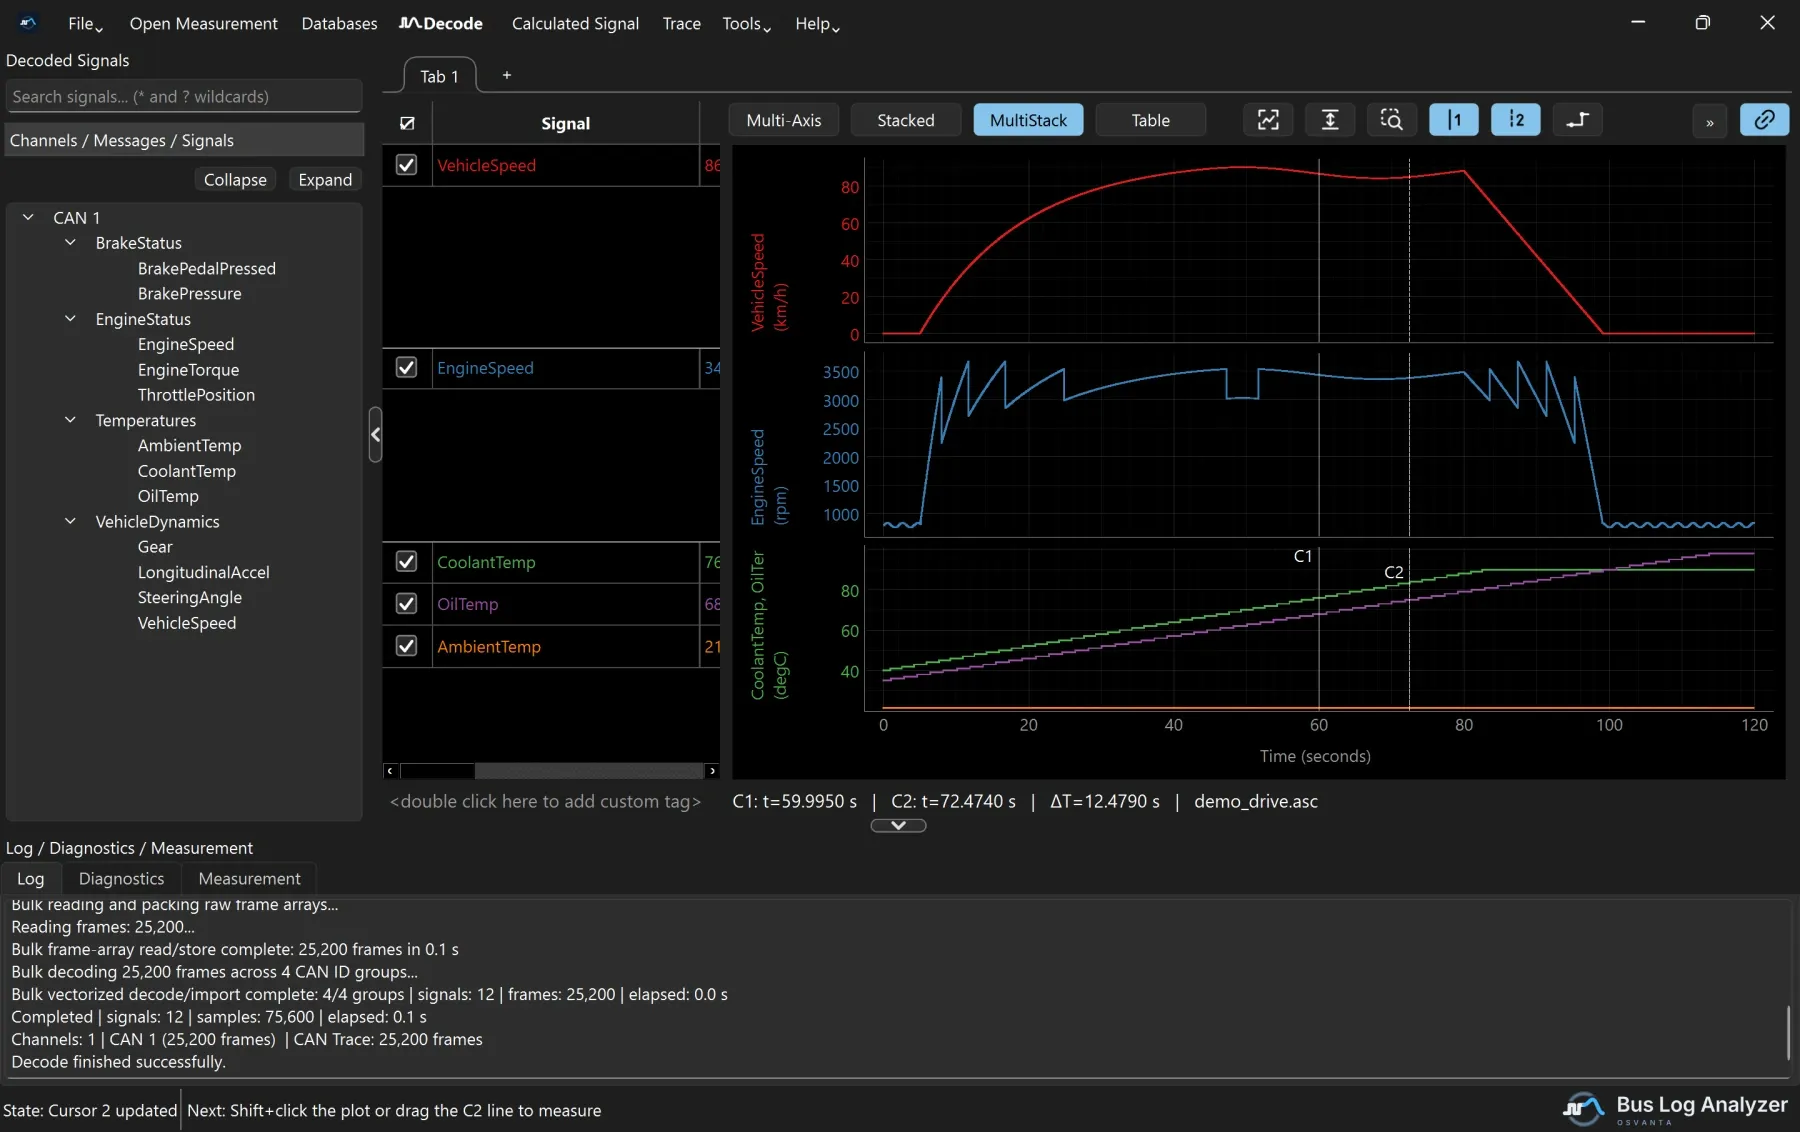
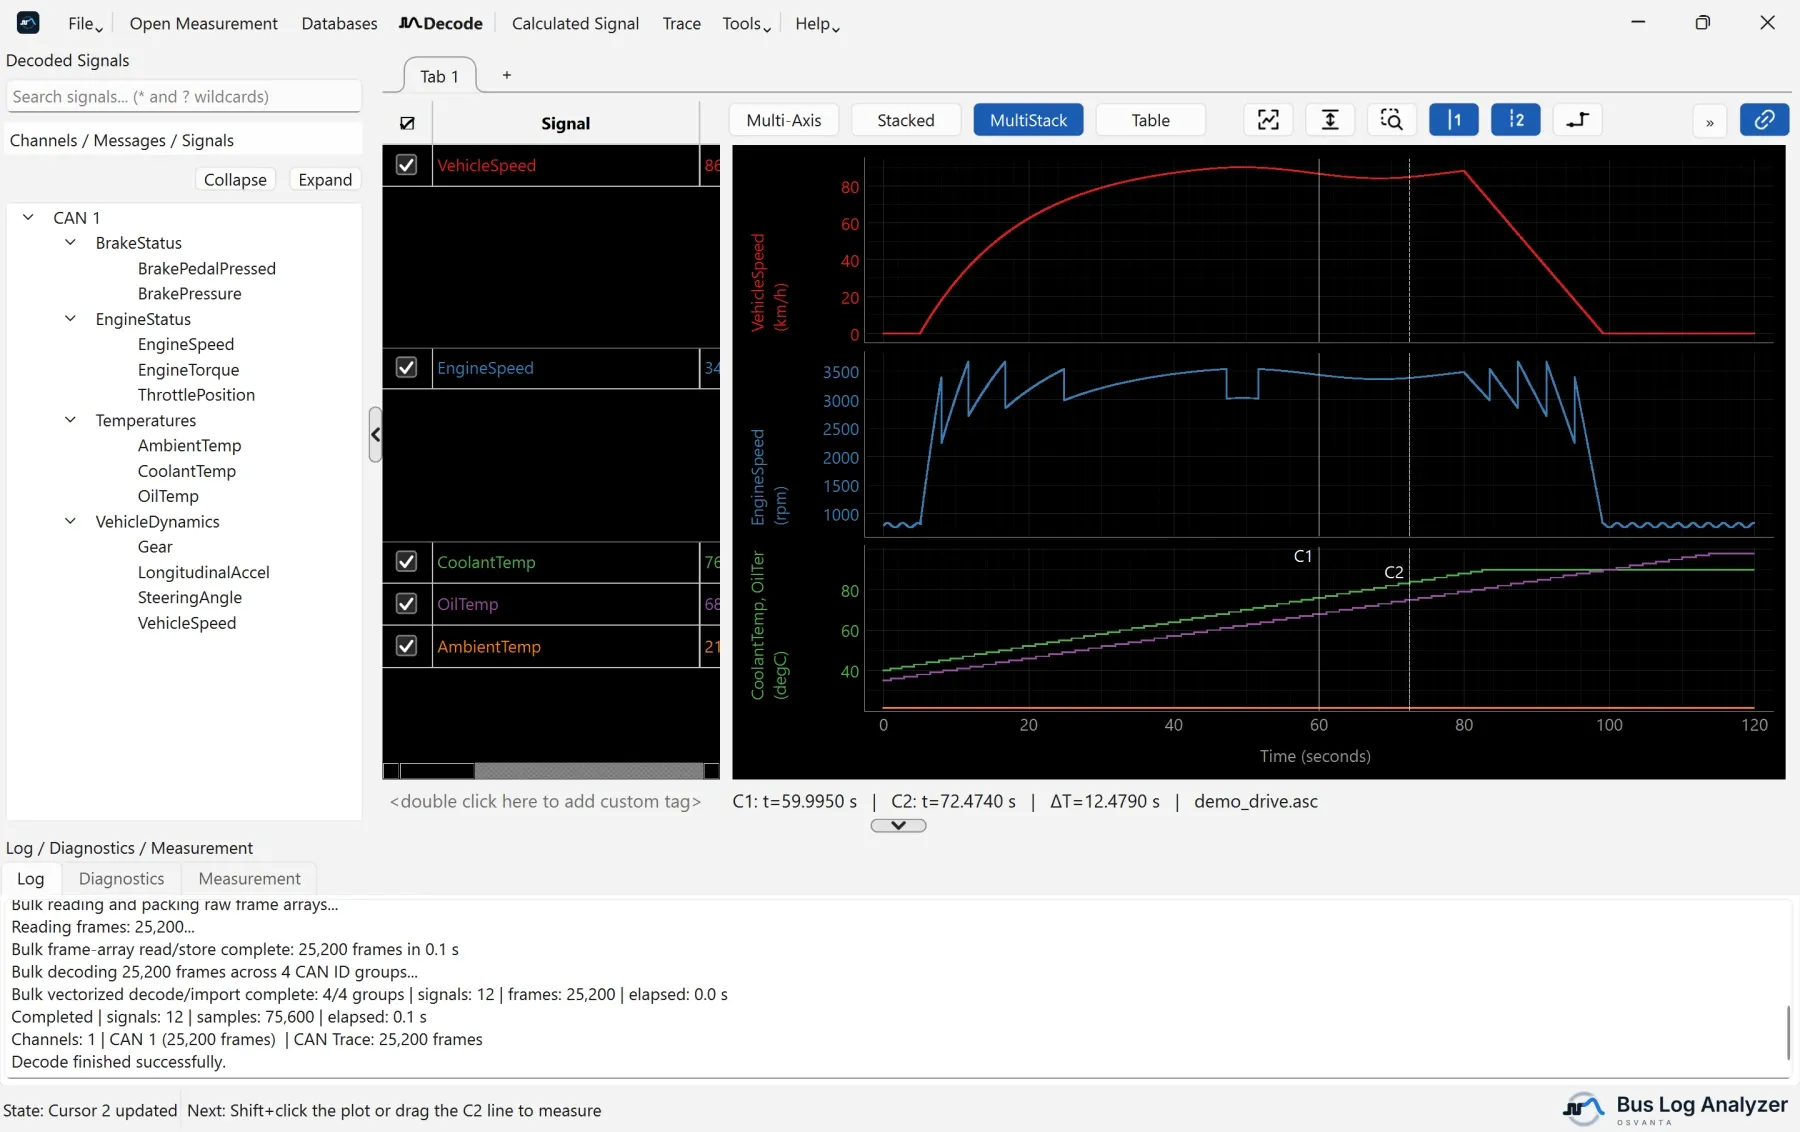
Lanes like in Stacked, but each lane can hold several signals. Use it to keep related signals together, such as all temperatures in one lane, and unrelated ones apart.
- Drag signals into a lane to overlay them there.
- The signal table splits to match: each lane gets its own part of the table, level with it, listing only its signals.
- Drag a signal from one part to another to move it to that lane, or within a part to change its order.
- A part with more signals than fit scrolls on its own.
- Signals of a lane whose signals are all unticked are listed under the last lane, so they can be ticked back on.
Table
The Table button, next to the three modes, lists the plotted signals as a table beside the plot, with a row per sample time. Use it to read exact values.
Tabs of plots
Each tab above the signal table and the plot has its own signals, signal table, plot mode and Table view.
| To do this | Do this |
|---|---|
| Add a tab | Click + |
| Rename a tab | Double-click it |
| Close a tab | Click its small x, or use its right-click menu |
| Move between tabs | Ctrl+Tab and Ctrl+Shift+Tab |
| Plot signals in a tab | Drag them from the tree onto the tab |
| Plot signals in a new tab | Drag them from the tree onto + |
| Move plotted signals to another tab | Drag rows from the signal table onto the tab, or right-click them and choose Move to tab |
While Synchronize Tabs, the chain-link button, is on, as it is at first, every tab shows the same time range and cursors. Markers, measurement events, the signal table’s columns and the line mode are the same in every tab.
Change how a signal looks
Right-click a signal in the signal table to:
- change its colour (
C); - give it a line style: solid, dashed, dotted or dash-dot;
- group it with others;
- hide it, or remove it (
Delete).
Drag rows in the signal table to change the order.
Line mode and data points
- The line-mode button (
S) switches between Step Mode, the default, where each value is held until the next sample, and Interpolation Mode, where straight lines join the samples. The icon shows the mode the plot is in. - Show Data Points marks each sample, with thinner lines.
- Hide Line is available while data points are shown, and displays the points without the lines.
Step Mode is the honest picture of a bus signal: the value is only known at each frame, and nothing is known in between.
Undo
Ctrl+Z undoes the last plot action, up to three times.