
Trace
Look at the raw CAN and LIN frames in order, with timing and changed bytes, linked to the plot.
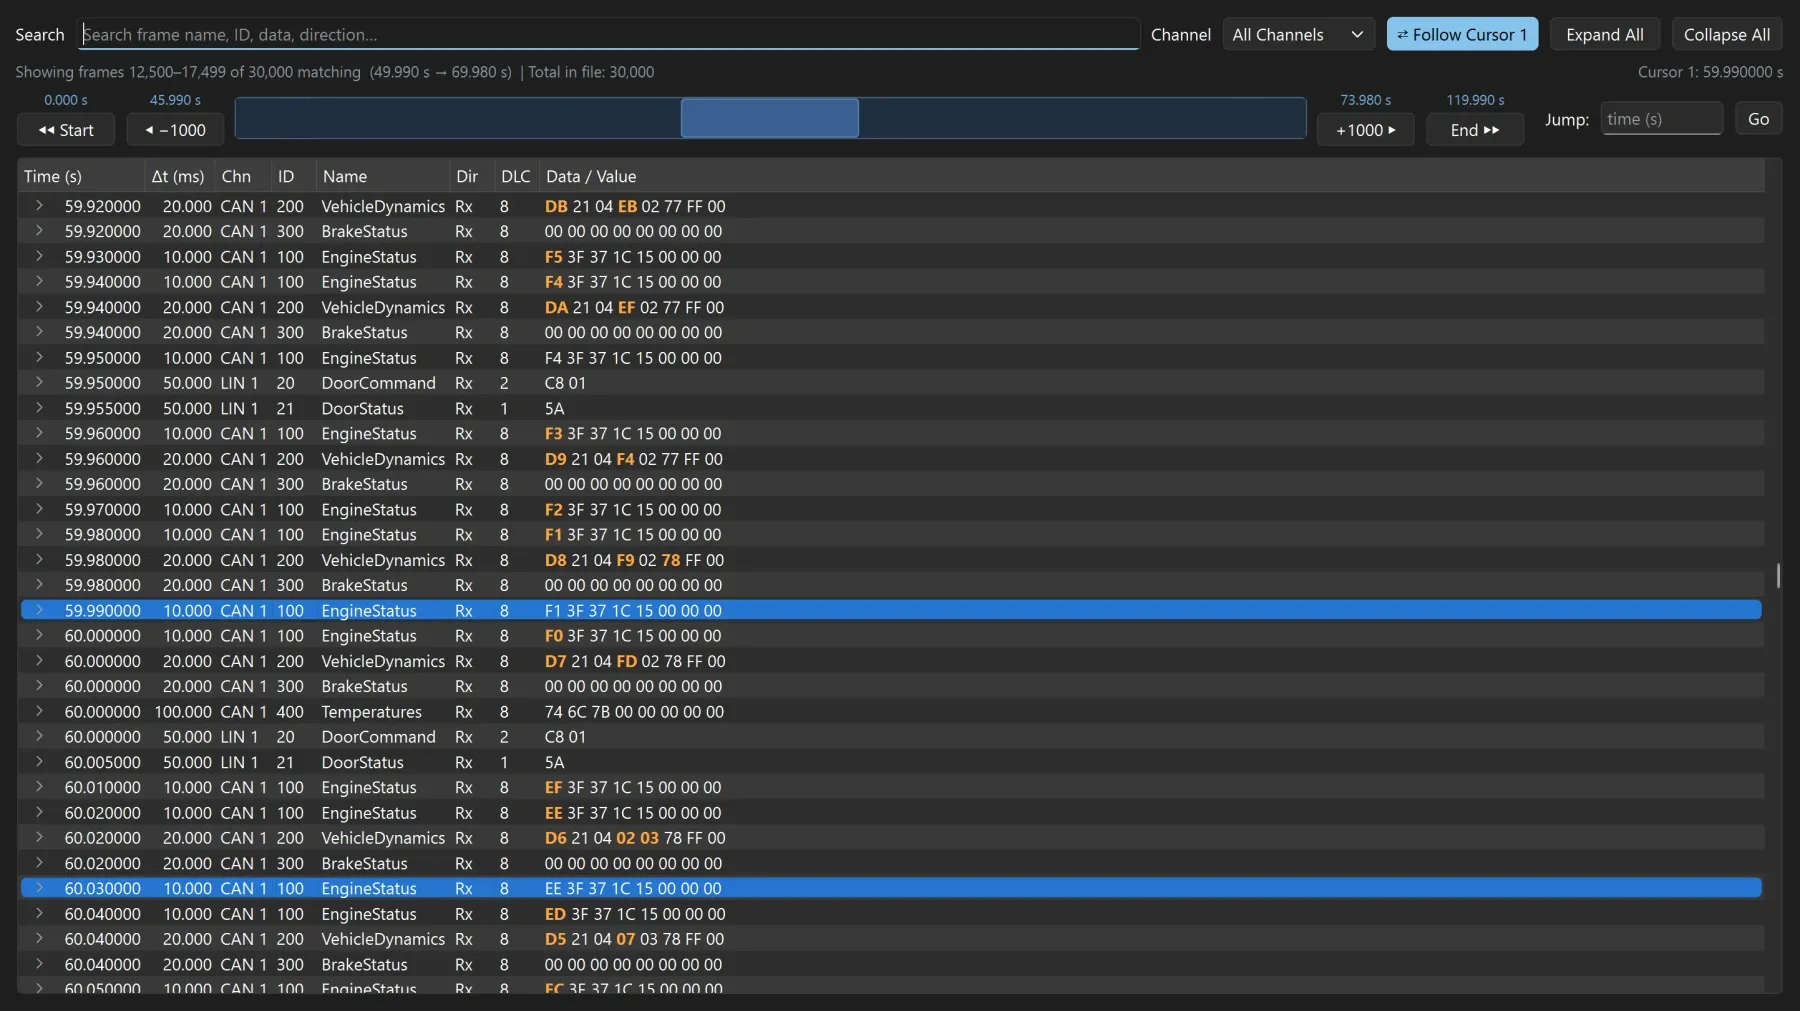
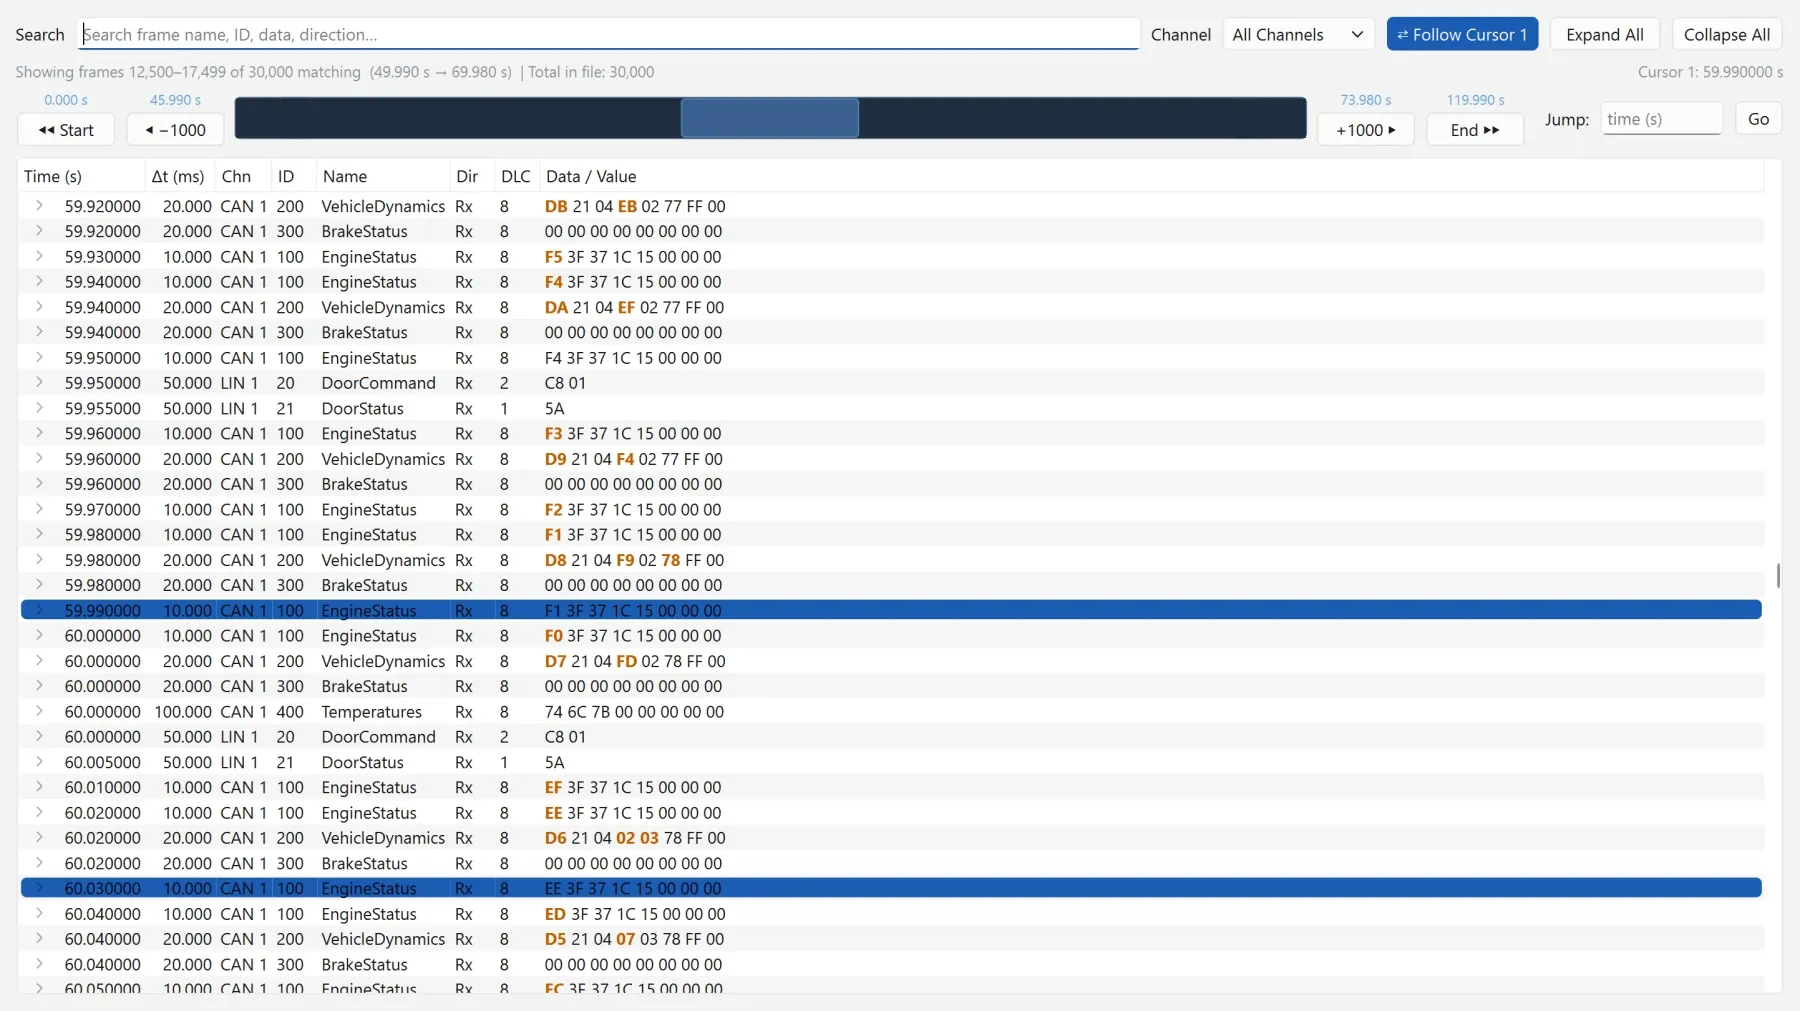
The Trace lists the raw CAN and LIN frames of the measurement, in order. Use it when a signal looks wrong and you want to see the bytes behind it, or to check the timing of a message.
Open the Trace
Click Trace (Ctrl+Shift+R). It is ready once a measurement has been decoded.
The Trace shows raw frames, so it needs a raw bus log. An MF4, MDF or CSV file that holds only decoded signals has no frames to show, and clicking Trace says so.
What the columns tell you
- Δt is the time since the previous frame with the same ID on the same channel. A message sent every 10 ms shows about 10 ms in every row; a larger value is a late or missing frame.
- Changed bytes: the bytes that changed since that previous frame are bold and coloured, so you see at a glance which part of a message is moving.
Right-click the header to turn either of them off.
Filter and decode
- Filter the list to the frames you are interested in.
- Decode a frame’s signals on demand, to see the signal values that frame carried.
Follow the plot
While ⇄ Follow Cursor 1 is on, the Trace and the plot move together, both ways:
- picking a frame in the Trace moves Cursor 1 to it;
- moving Cursor 1 on the plot brings its frame into view in the Trace.
This is the quickest way to get from a strange value on the plot to the exact frame that carried it.